Block 1: Week 4 Visualisation
What conversations am I engaged in?
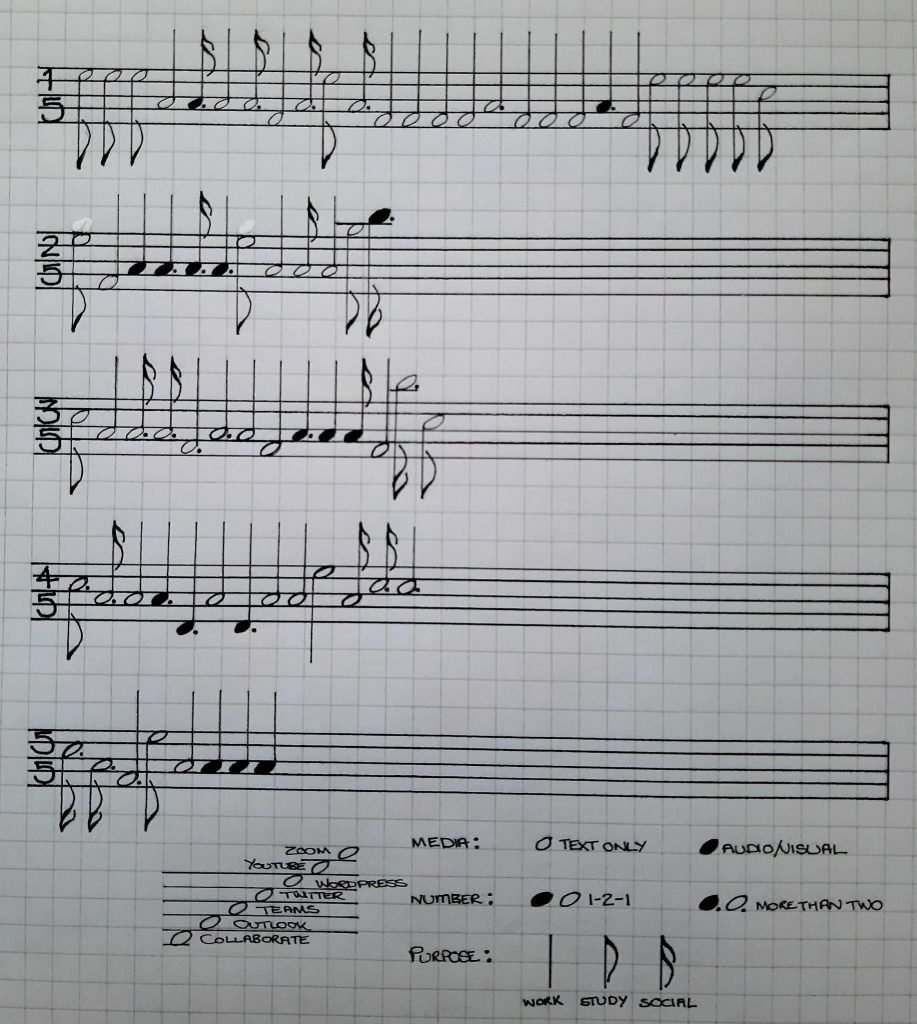
Now working full-time from home, studying online, and in lockdown, I was interested to know more about the conversations I was engaged in.
Methodology
I recorded data about any conversation, defined as a situation where information was exchanged betweeen myself and at least one other person. Again, I kept the number of variables small to make manual recording manageable, and simplified the detail to ensure privacy.
Results and Analysis
The experience of having done this in Week 3 enabled me to focus and not try to record every aspect. I also decided to experiment with my visualisation, go further from ‘graphing’, co-opting a representation from another field, to try to help separate the data from the activity that generated it.
How does this relate to my learning activity?
- Again, the visualisation uses partial, self-reported data and lacks context.
- Again, I am controlling this data gathering. However, this probably had minimal effect: I have little idea of certain patterns being more creditable than others, so am less likely to self-edit. As a student, an automated system may, however, have its own ideas (based on theory, performance of others etc.) and offer nudges, without personal context, possibly steering away from a strategy that works for me.
- Again, considerably more data would be needed to identify trends, although you can see the high use of Teams which replaced on-campus meetings and some use of email.
- Although, some in-depth data on each conversation could have been collected, the actual value (of these conversations) might not be determinable until later, and not related to that data.
- Recording my personal reactions (e.g. satisfaction, targets achieved) is not the only, nor possibly main, measure of success of a conversation (since there are others involved). This is perhaps important, when automated systems may nudge a student towards attaining their goals (as it sees it), but perhaps forgets the behaviours this student contributes towards the cohort.
This is beautiful! I would love to know how your visualisation would have looked like before the pandemic. I definitely feel like my world has become a lot smaller in terms of speaking to people. This may be insignificant for us online students but could potentially have a huge impact on on-campus students.
Thanks, Susanne.
This is a great visualization Tracey, and commentary too. Conversation is such an interesting topic of analysis, and you’ve clearly indicated the chain of decisions you have had to make to ‘fit’ conversation into a quantifiable format. Do you feel this was like a chain of reductions you were having to make? It also got me thinking about some of the more out-there ideas about recording conversations for analysis to make automated recommendations — apparently Spotify plans to do so to make mood-related music suggestions based on tone of voice etc. The collection and analysis of sonic data seems to be growing now so many people own smart speakers. And of course the smart speaker companies are eager to get into education. So I wonder if new forms of sonic learning analytics or automated conversation analysis could be on the horizon, and what kind of implications might possibly emerge from this? Having visualized your own conversations this week, can you think of any further implications that might emerge from analyzing students’ sonic data? Thanks for such a stimulating post and viz.
Yes, this is very much a reduction: I don’t say that this is the ‘truth’ about my conversations, this is much more art than science. And a performance: would I create a completely different visualisation in a private blog? Absolutely!
Sorry to be a cynic, but I can’t help but see any analysis of tone of voice not managing to be sexist/racist etc. based on recent history. There is human judgement of others on how they sound, not just to try to detect information, but rate them against expectation (acceptable kinds and levels of emotion). And I have seen how subtitling software is trained and how that is biased by the choice of language training data. So I can’t imagine that such factors would not find their way into voice analysis tech.
Is Spotify going to offer me soothing music because it thinks I sound upset? Does it think it should be modifying my emotional state (and it’s so trivial that music alone would do it)? Will I start to modify my voice because otherwise Spotify is going to start playing me Enya until I do?
Hey Tracy, Great Viz. Again conversation is definitely an essential factor to measure and its effects on learning cannot be overemphasized. I think like you mentioned the manual data tracking might be a bit on the steep side but if properly done can give great insights into one’s personality. workaholic, social, or just bookaholic. Thanks this is educative and fun.
Thank you! I think I will return to the idea of conversations again in the future, perhaps from a different perspective.