

Rationale.
This week’s data gathering is aimed to link the past block to this one. The central idea is around the notion of replacing teachers. Bulger’s (2016) extensive study mentions that teacher’s expertise in the subject and experience influence the outcomes. However, it is harder to do the more students a teacher has in the classroom. Data and dashboards are supposed to solve this problem. But the reality is that educators have been signalling for years that classes of 30+ pupils aren’t optimal. So even if this technology is not replacing existing teachers, it is to replace the extra teachers that should be hired. Naturally, this trend is self-perpetuating in the neoliberal economy (Williamson et al 2020). Once a metric system is developed for this purpose, it can be applied any number of times, further eliminating the need for teachers. Worse yet, in ‘society of rankings’ (Williamson et al 2020 p. 351) we can rank, as I did, how teachers fare as sources of knowledge against other means. It can put them at a clear, and quantifiable, disadvantage.
Another aspect has to do with availability of information. For centuries, teachers were the gatekeepers of knowledge. Lectures were the main source of information for students. Since the advent of the internet, this has changed. In contrast to the centuries of access obstacles, now we are bombarded with information. Even 10+ years ago, when I was studying, the university lecturers were who you turned to for recommendations of courses. Now, the online library search engines show if an article was peer reviewed. Any book and its authors an be verified for their academic merits after a quick Google search.
I deem the tendency to replace teachers with metrics negative for several reasons. The main one is that teachers left to interpret the information will inevitably have incomplete data. For example, any large deviation from the average performance will show the what, but not the why (Eynon 2013). In classroom a skilled and experienced teacher can pick up on non-verbal cues to assess this. Datasets won’t carry this information. This poses great risk for many students, for example, those who are neurodivergent. Those students especially will also fare poorly even if numerical data is accomapnied by face recognition technologies.
Metrics.
This time I set out to see where I learn from. I limited this study to reliable and valuable information tidbits that I could recall at the end of the day, like ‘the agricultural revolution started 12 000 years ago’ (Baron-Cohen 2020). The social media are only considered in the instances where I learned something from reliable channels (e.g. verified scientific profiles, as opposed to gossip pages). The books include only the two books I am currently reading (The Pattern Seekers, and The Ethical Algorithm).
I focused on all verifiable, valuable information, not just what I learn for the two courses I am taking this semester. However, this can be clearly extrapolated by contrasting the ‘Msc teachers’ circle to the ‘academic articles’ and ‘books’.
I continued to mark who I repeat the information to because I enjoyed it last week. it was easy to incorporate into this data, and did not obscure it visually.
Design.
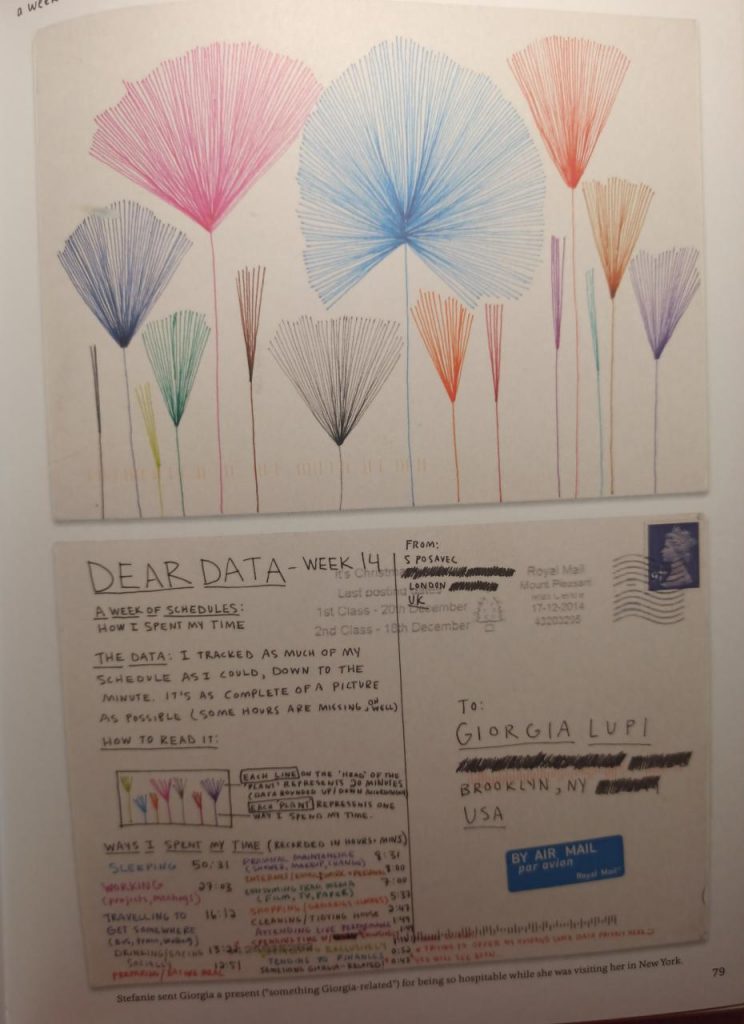
The following designs from Dear Data inspired this look:


Sources.
Baron- Cohen, S. (2020) The Pattern Seekers. How Autism Drives Human Invention. Basic Books.
Bulger, M. 2016. Personalized Learning: The Conversations We’re Not Having. Data & Society working paper.
Eynon, R. (2013). The rise of Big Data: what does it mean for education, technology, and media research? Learning, Media and Technology, 38(3), pp. 237-240.
Lupi, G. Posavec, S. (2016) Dear Data. Princeton Architectural Press
Williamson, B. Bayne, S. & Shay, S. (2020) The datafication of teaching in Higher Education: critical issues and perspectives, Teaching in Higher Education, 25:4, 351-365
‘we can rank, as I did, how teachers fare as sources of knowledge against other means. It can put them at a clear, and quantifiable, disadvantage.’
Really excellent rationale for this visualisation. I guess we also need to have a definition of what ‘teaching’ is here too, which reminds me of some of the themes from the IDEL course. If we think about teaching as embodied within a course environment and it’s resources, how do we quantify that?
‘For centuries, teachers were the gatekeepers of knowledge.’
In some respects yes. But socioeconomic conditions were also a barrier, circumstances which often haven’t changed, despite ‘information’ being more widely available.
‘In classroom a skilled and experienced teacher can pick up on non-verbal cues to assess this. Datasets won’t carry this information.’
I think this is useful, in the sense that data might be valuable for measuring very specific aspects of students, but not for ‘knowing’ our students, and that is an important aspect of any teaching.
A really thoughtful data vis, I like it a lot. I can see how you have really embraced the ‘Dear Data’ feel to your visualisations. I enjoyed your commentary about the replacement of teachers and how your data really speaks to that. You mentioned small scale societies and anthropologists often comment on individuals fill that ‘teacher’ role quite naturally in hunter-gatherer society. Because those societies are organised to prevent individuals obtaining power, it works. But in our complex society it is hard to escape power politics and using data to wrest power from teachers seems like the latest chapter in that book.